

Beyond the Spotlight: A Deeper Dive into Cruise Entertainment Spend by Brand and $/ALBD Intensity
- Franz Mehrfert
- Dec 7, 2025
- 10 min read

Updated: Jan 12

By Franz Mehrfert, Independent Consultant
Updated December 23, 2025
1. Introduction
Estimated total spend intensity the Ocean Cruise Entertainment industry
The total estimated spend in my first blog post for the global Ocean Cruise Entertainment industry in 2025 has now been revised up ~15% to ~$2.09 billion. That increase reinforces a key takeaway from the first report: Entertainment is no longer just a cost center—it is a meaningful revenue driver and brand differentiator.
This multi-billion-dollar engine driving guest satisfaction and brand identity is a complex web of shoreside management, onboard staff & performers, contractors, vendors/suppliers, onboarding & travel partners, talent partners, technical support teams, media licensing partners, legal/HR partners, regulators and creatives. This second installment is intended for performers, vendors, investors, and cruise professionals looking to understand how total Cruise Entertainment capital is deployed across this complex web, what it reveals about brand-level strategic priorities, and how vendors & partners can better align their services to match.
With new ships entering service and fleet size continuing to expand, total industry capacity, measured in Available Lower Berth Days (ALBD), is estimated at ~260 million guest days for 2025. For context, CLIA projects that roughly 37.5 million passengers will sail onboard this year.
Throughout this analysis, I’ll use Entertainment spend per Available Lower Berth Day ($/ALBD) as the core benchmark. This metric allows us to transparently compare true investment intensity across brands on a “capacity-normalized” basis—whether it’s a 5,000-guest mega-ship or a 500-guest luxury vessel. In simple terms, it shows how much each brand is willing to invest in Entertainment per guest, per day, and where – thereby revealing the most meaningful strategic differences between them.
[Updated to include 2025 FY & 4Q Financials from Carnival Corporation - 19-Dec-2025]
Disclaimer: This blog post is based on publicly available information, industry reports, and independent modeling. It does not contain insider information or proprietary trade secrets. All figures are estimates and should not be construed as official financial disclosures. We make no representation or warranty as to the accuracy, completeness, or suitability of the information for any specific purpose. All group‑level revenue, operating cost, and ALBD metrics are calibrated against the most recent annual SEC filings and statistical operating data. Brand‑level figures are modeled estimates derived from fleet capacity, deployment, and relative pricing, not reported company financials. Forward‑looking statements based on published fleet deployment, capacity growth, and historical financial relationship are subject to change based on market conditions, fuel pricing, labor agreements, shift in Entertainment strategy, regulatory or itinerary changes, fleet deployment, and company reporting. All investments involve risk, and past performance is not indicative of future results. Readers must consult qualified financial, legal, or tax advisors before making any investment or business decisions based on these estimates or any information contained herein.
Full Report Outline:
1. Introduction
Brief recap of my first post: sizing the Cruise Entertainment industry in 2025.
Why this deeper dive matters: spend transparency, strategic priorities, and vendor alignment.
Introduction of $/ALBD as the key metric for capacity-normalized analysis
2. Executive Summary: Cruise Group & Market Level Overviews, Metrics, Takeaways & Insights
[Request access to read the full report here]
Connect with me for strategic consulting, vendor alignment, or partnership development.
3. Deep Dive: Total vs. $/ALBD Spend Intensity
Total Entertainment $/ALBD spend by market segment, groups & brands (2025 estimates)
Entertainment $/ALBD — who spends the most per guest day?
Commentary: Parent Group strategies
4. Category Breakdown: Where the Money Goes
Spend per ALBD by category (Onboard, Shoreside, Licensing, Production, Training/Rehearsal, CapEx/Refurbishment)
Analysis: Which market tiers, groups & brands prioritize talent, technology, or licensed content?
Strategic insights: Cost Drivers, group & brand differentiation and market segments.
5. Capital Projects and Licensing: The Hidden Costs
Dry-dock CapEx: how much is spent on Entertainment venue upgrades.
Licensing spend: Broadway shows, music rights, karaoke platforms.
Commentary: Why these costs are rising and how brands manage them
6. ROI and Revenue Fusion: Entertainment as a Profit Engine
Onboard revenue & Entertainment Fusion: bar, casino, specialty dining, wellness
Fusion examples: Entertainment-driven dining and spa experiences
ROI modeling: which brands get the most return on Entertainment investment.
7. Strategic Implications for Vendors, Suppliers, Talent Partners and Consultants
Who’s spending efficiently? Who’s exposed to cost pressure?
Opportunities for talent agencies, AV integrators, and licensing consultants
Wide perspective: how cruise brands can optimize spending and elevate guest experience
8. Conclusion
Summary of key findings
Call to action: contact franz@franzmehrfert.com for strategic consulting, vendor alignment, or partnership development.
My next post: talent logistics and performer sourcing in the cruise industry
Appendix I – Methodology and Modeling Post-Script
Appendix II – Comprehensive Public Source List
2. Executive Summary: Cruise Group & Market Level Overviews
Global Cruise Entertainment ecosystem investment is projected to reach ~$2.09 billion in total spend across ~260 million ALBD in 2025, spanning five primary cruise market segments. This expenditure reflects a post-pandemic reset driven by newbuilds, refreshed fleets, rising guest expectations, and intensive brand differentiation.
Industry-wide Entertainment spend now averages ~$8.06 per Available Lower Berth Day (ALBD), representing:
~3.03% of total operating expense (OpEx)
~4.52% of Net Cruise Costs (excluding fuel)
~2.55% of total gross revenue
At scale, Entertainment is no longer a discretionary line item - it now functions as a core competitive lever for pricing power and brand identity, and a measurable driver of onboard yield optimization.
2.1 Industry-Wide Key Metrics (2025 Estimates)
Total Entertainment Spend: ~$2.094 B
Fleet Capacity: ~259.93 M ALBD
Average Spend per ALBD: ~$8.06
Average Entertainment % of Overall OpEx: ~3.03%
Average Entertainment % of NCC ex-fuel: ~4.52%
Overall Industry Revenue: ~$82.21 B
Overall Industry OpEx: ~$69.1 B
Overall Industry Net Income: ~$13.1 B
Across the industry, Entertainment has shifted from a variable expense to a structurally committed strategic allocation. Once a brand selects its market positioning, its Entertainment cost profile is effectively locked in.
The following table summarizes key estimates of the 2025 investment metrics for the major cruise groups, with an industry-wide summary, based on internal modeling:

2.2 Key Group-Level Takeaways
The industry’s projected ~$2.094B Entertainment investment is driven primarily by experience competition, new-ship complexity, and IP-driven programming strategies.
Carnival Corporation leads in total Entertainment investment at approximately ~$672M, largely due to its sheer scale (~95.3M ALBD), while maintaining a relatively efficient ~$7.05 per ALBD. This includes P&O AU vessels operational in Q1 and then transferred to CCL later in the year.
Royal Caribbean Group follows at roughly ~$443M total spend across ~56.4M ALBD, or $7.86 per ALBD, reflecting its heavy reliance on high-tech venues and destination-style attractions to drive differentiation.
NCL Holdings (~24.7M ALBD) is the clear spend-intensity leader among the major public groups at approximately $9.31 per ALBD, driven by IP-heavy, performer-dense programming across Norwegian, Oceania, and Regent.
MSC Cruises (~36.8M ALBD) remains the least transparent from a financial disclosure standpoint, but modeling suggests a leaner Entertainment profile at approximately ~$7.01 per ALBD, favoring modular, outsourced, and scalable production models.
Disney Cruise Line and Virgin Voyages both sit well above premium-market norms, driven by proprietary IP (Disney) and immersive lifestyle-led programming (Virgin).
To reflect these realities, the model applies targeted upward adjustments to RCL, MSC, Disney, and Virgin relative to baseline Entertainment-to-Revenue assumptions, recognizing the heavier CapEx, production, and infrastructure commitments embedded in their brand strategies.
[Request access to read the full report here]
Connect with me for strategic consulting, vendor alignment, or partnership development.
2.3 Market Segmentation
Each cruise brand operates within a core market segment, and that positioning directly dictates how Entertainment dollars are deployed:

While some brands flex across tiers based on vessel class or itinerary, most exhibit a stable long-term Entertainment investment profile aligned with their commercial positioning.
Here’s how estimated financials for the five main market segment tiers and respective brands compare:

At a high level:
Luxury and Ultra-Luxury segments command the highest $/ALBD spend, with estimated %’s of total spend higher than total %’s of ALBD for their respective tiers, reflecting the need to curate unique Entertainment offerings for high‑value guests and experience-led value propositions.
Mass and Premium segments dominate total guests, ALBD, and revenue, and therefore account for the majority of the industry’s total entertainment spend—despite lower per-guest intensity.

Here’s how the major brand parent companies and groups estimated financials breakdown:

2.3.1 Entertainment Cost Drivers per Market Tier:
Segment Primary Spend Driver
Mass Market Salaries + Production Efficiency
Premium Balanced Mix Across All Categories
Luxury Talent, Enrichment, Guest Artists
Ultra-Luxury Personalization + Resident Performers
Expedition Destination Experts + Educational Programming
As brands move upscale, talent replaces hardware as the dominant value driver.
[Request access to read the full report here]
Connect with me for strategic consulting, vendor alignment, or partnership development.
2.4 Strategic Divergence by Parent Group
Distinct investment philosophies are clearly visible at the group level:
Carnival Corporation: High-volume, efficiency-driven ROI across nine brands. Entertainment spend is tightly managed as an operating input.
Royal Caribbean Group: CapEx-led strategy centered on proprietary venues and large-scale, technology-driven productions, with Broadway show IP featured on many vessels.
NCL Holdings: IP-heavy, talent-dense programming where Entertainment acts as a brand signature, especially at the ultra-luxury end.
MSC Group: Scalable, outsourced, and modular programming with comparatively lean per-guest intensity.
Major Independents (Disney, Virgin, Viking): Immersive, identity-driven Entertainment strategies that blend lifestyle branding, cultural enrichment, and proprietary programming.
2.5 Top Brand $/ALBD Outliers in Entertainment Spend (2025)
A small group of brands consistently push well above estimated baseline Entertainment investment:
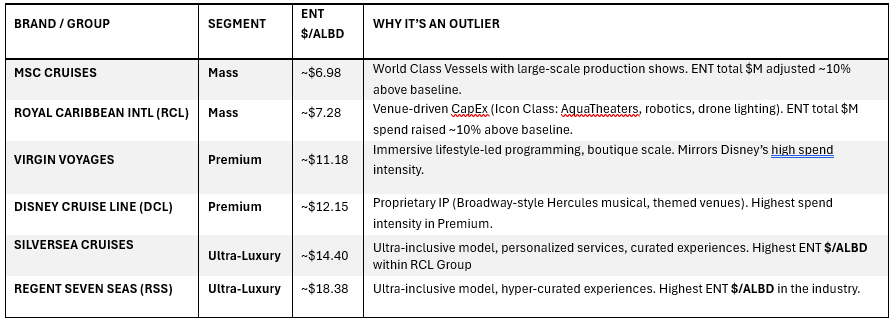
These outliers clearly signal where vendor demand, IP dependency, and cost pressure are structurally highest.
2.6 Executive Insights
Entertainment spend is no longer just a reflection of scale—it is a deliberate strategic choice:
Mass brands now push above baseline to defend share against premium competitors.
Premium brands increasingly overlap luxury spending levels to maintain pricing power.
Ultra-Luxury and boutique brands show structurally high $/ALBD due to personalization, enrichment, and overhead concentration.
Where a brand lands on the $/ALBD curve tells you exactly how it intends to compete.
2.7 Vendor Implications (High-Level)
High CapEx brands (Royal, NCL, Disney, Virgin) favor turnkey AV systems, IP-driven production, and immersive venue design.
Efficiency brands (Carnival, MSC) prioritize automation, sourcing efficiency, and scalable content.
Boutique and luxury brands (Silversea, Seabourn, Azamara) require high-touch talent logistics, enrichment programming, and flexible production support.
For vendors and consultants, this spend profile effectively serves as a targeting map for where opportunity—and margin—can be found; aligning offerings with brand priorities and cost structures is a blueprint for competitive strategy. Using the $/ALBD spend intensity data presented here is key to understanding where strategic priorities diverge by cruise brand from baseline and allows for alignment of value propositions with the specific Entertainment Investment Profile of their target brands, to help drive ROI. For cruise operators, the challenge is to optimize spending while elevating guest experience.
With over 42 new ocean cruise vessels, each over 100,000 gross tons and carrying 3000+ guests, already on order over the next 10 years, the growing cruise vacation market is demanding a balance between high-quality content and operational agility. Are vendors well positioned to capture the growth of the high-spending CapEx brands or provide the efficiency demanded by the Mass market brands?
2.8 Full Report Access
Connect with me for strategic consulting, vendor alignment, or partnership development to ensure your Entertainment strategy is an ROI machine, not a cost sink.
Ready for the Deep-Dive Granular Data?
This post shares the high‑level insights, but the complete 30‑page analysis includes brand‑by‑brand breakdowns, category allocations, ROI modeling, and vendor implications. Access the full “deep-dive” article on the $/ALBD for 54 individual brands, and a 1-hour strategic consultation to apply these insights to your business.
Request the full article via email to explore detailed data and modeling.
👉 Request the full report here.
2.9 Notes on Methodology, Limitations & Disclaimers:
i. This report reflects independent analysis and proprietary financial modeling developed by Franz Mehrfert, Independent Consultant. All figures related to Entertainment spend, operating expense, and revenue are estimates and projections, not audited financial data, and should not be interpreted as official company disclosures.
ii. All inputs used in the model are derived exclusively from publicly available information, including Cruise line SEC filings (10-K, 10-Q, 8-K), Industry reports, Fleet deployment data, and Passenger capacity and occupancy benchmarks. No confidential, non-public, or insider information is used or implied.
iii. Core Modeling Framework
a. Entertainment Spend Baseline - Total Entertainment spend is estimated at approximately 2.51% of projected gross revenue (ticket + onboard), based on historical industry averages observed across major operators.
b. Capacity Normalization (ALBD) - Spend intensity is expressed as $/ALBD (Available Lower Berth Day) to enable like-for-like comparisons across brands of vastly different scale.
c. Category Allocation - Entertainment spend is distributed across six cost categories, including Onboard Programming & Salaries, Shoreside Administration, Licensing & IP, Production, Training & Rehearsal, Refurbishment & CapEx. These allocations are based on a proprietary operational benchmarking model aligned with known cruise operating structures.
d. Model Adjustments - Targeted upward adjustments (~10%) were applied to Royal Caribbean Group, MSC, Disney Cruise Line, and Virgin Voyages to reflect their elevated CapEx intensity, proprietary venues, and immersive production strategies.
iv. Scope & Exclusions
a. This analysis covers ocean-going cruise brands only and excludes River cruises, Private yacht charters and/or brands not operational in 2025.
b. Private Island Entertainment infrastructure is excluded, except where onboard personnel deliver Entertainment programming ashore.
c. Some boutique brands (e.g., SeaDream, Hebridean, Nicko) appear as $ / ALBD outliers due to structural overhead and limited scale—not modeling error.
v. Category Overlap & Accounting Variability
a. Entertainment spend often crosses traditional accounting boundaries between Onboard departments, Shoreside administration, and contracted turnkey production vendors.
b. For example:
Guest entertainers may be booked as shoreside expense but function operationally as onboard staff.
Some cruise lines operate in-house rehearsal facilities, while others fully outsource casting, training, and show operations.
c. Where these variations are known, they are reflected at the brand level to maintain internal model consistency. However, precise category allocation will vary by company.
vi. Forward-Looking Estimates
a. All group‑level revenue, operating cost, and ALBD metrics are calibrated against the most recent annual SEC filings and statistical operating data. Brand‑level figures are modeled estimates derived from fleet capacity, deployment, and relative pricing, not reported company financials.
b. All 2025 projections are forward-looking estimates based on published fleet deployment, capacity growth, and historical financial relationships. Actual results may vary materially due to market conditions, fuel pricing, labor agreements, shift in Entertainment strategy, and regulatory or itinerary changes.
vii. Use of This Analysis and Disclosure of Risk
a. This report is provided for informational and general strategic planning purposes only and does not constitute investment advice, is not a solicitation to buy or sell securities, and should not be relied upon for financial decision-making. We make no representation or warranty as to the accuracy, completeness, or suitability of the information for any specific purpose.
b. All investments involve risk, and past performance is not indicative of future results. Readers must consult qualified financial, legal, or tax advisors before making any investment or business decisions based on these estimates or any information contained herein.
Curious to learn more? Interested in an entertainment career at sea?
Looking to expand your business into the cruise entertainment industry?
Book a free initial online appointment to explore how my consulting services might match your current needs or contact me to connect.
